Understanding Odds & Payouts in Satta Matka: The Complete Mathematical Guide
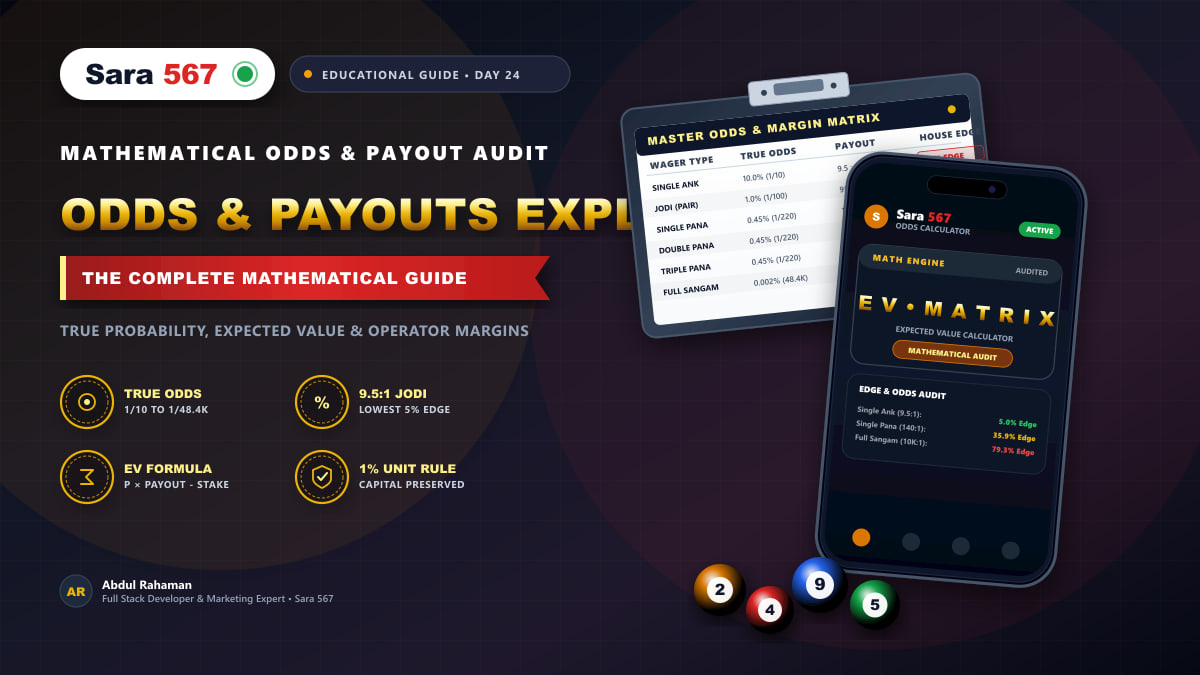
Understanding Odds & Payouts in Satta Matka: The Complete Mathematical Guide
In numerical gaming and financial probability, numbers do not have feelings, memories, or divine favor. Every outcome declared across major markets—from Kalyan Matka to Milan Night—is governed by immutable laws of combinatorics and probability distributions.
Yet, a staggering majority of participants evaluate wagers solely on the size of the payout multiplier. A beginner sees a 900:1 return on a Triple Pana or a 1,400:1 multiplier on a Half Sangam and perceives a fast track to fortune. What they fail to calculate is the true mathematical probability of occurrence, the implied odds, and the built-in operator house edge.
Without understanding the mathematical link between payout ratios and true probability, players inevitably fall victim to the gambler's fallacy, chasing long-shot odds with catastrophic bankroll exposure.
In this educational masterclass, we dismantle the mathematics of Satta Matka. We evaluate every bet type—from Single Ank to Full Sangam—calculating exact sample spaces, true odds, payout rates, expected value ($EV$), and the mathematical reality of operator margins.
Table of Contents
- Core Probability Mechanics: True Odds vs. Payout Odds
- The Combinatoric Sample Space of Matka
- The Complete Odds & Payout Master Matrix
- Deconstructing Every Wager Type
- The Concept of Expected Value (EV) & Operator Margin
- Long-Term Capital Decay: The Compounding Cost of the Edge
- Mathematical Risk Management: Kelly Criterion vs. Fixed Units
- Frequently Asked Questions (Odds & Payouts FAQ)
1. Core Probability Mechanics: True Odds vs. Payout Odds
To evaluate any numerical market rationally, one must master the distinction between True Probability and Payout Multipliers:
-
True Mathematical Probability ($P$): The actual frequency with which an event occurs within a fair, unrigged random trial. If there are 10 possible digits (0 through 9) and each has an equal chance of appearing, the true probability of any single digit appearing is: $$P(\text{Single Ank}) = \frac{1}{10} = 0.10 \text{ (or } 10%)$$
-
Fair Payout Ratio: In a zero-sum game with zero house edge, a fair game pays the reciprocal of true probability: $$\text{Fair Payout} = \frac{1}{P} = \frac{1}{0.10} = 10:1$$ Under a truly fair 10:1 payout, wagering ₹100 on every number from 0 to 9 costs ₹1,000, and the winning digit returns ₹1,000, leaving net expected profit at exactly zero.
-
Commercial Payout Ratio: In practical commercial markets, operators do not offer fair odds; they must cover technological infrastructure, edge server bandwidth, licensing, and net profit. Instead of paying
10:1on a Single Ank, the market standard payout is typically9:1or9.5:1(often quoted in Indian vernacular as "10 ka 90" or "10 ka 95").
The gap between the fair mathematical payout ($10:1$) and the commercial payout ($9:1$) represents the House Edge or Operator Margin.
| Metric | Single Ank (0-9) | Jodi (00-99) | Single Pana (SP) | Triple Pana (TP) |
|---|---|---|---|---|
| Possible Outcomes | 10 unique digits | 100 unique pairs | 120 unique panels | 10 unique panels |
| True Probability | 10.00% ($1/10$) | 1.00% ($1/100$) | 0.4545% ($1/220$) | 0.0454% ($1/2200$) |
| Fair Mathematical Payout | 10 : 1 | 100 : 1 | 220 : 1 | 2,200 : 1 |
| Standard Market Payout | 9 : 1 (or 9.5:1) | 90 : 1 (or 95:1) | 140 : 1 to 150 : 1 | 600 : 1 to 900 : 1 |
| Operator Margin (House Edge) | 5.0% - 10.0% | 5.0% - 10.0% | 31.8% - 36.4% | 59.1% - 72.7% |
2. The Combinatoric Sample Space of Matka
Before analyzing payouts, we must understand the combinatoric geometry that creates Matka numbers.
A standard Matka draw consists of three cards drawn from a deck (or three digits drawn from 0 to 9 with replacement, arranged in strictly ascending order). This 3-digit combination is known as a Pana or Panel.
The entire universe of 3-digit combinations in non-descending order consists of exactly 220 unique Panas:
| Pana Classification | Digit Structure | Mathematical Definition | Unique Combinations | Probability of Category |
|---|---|---|---|---|
| Single Pana (SP) | 3 Unique Digits | Combinations of 10 items chosen 3 at a time: $\binom{10}{3} = \frac{10 \times 9 \times 8}{3 \times 2 \times 1}$ | 120 panels | 54.55% ($120/220$) |
| Double Pana (DP) | 2 Identical + 1 Unique | Permutations of pairs: $10 \times 9$ | 90 panels | 40.91% ($90/220$) |
| Triple Pana (TP) | 3 Identical Digits | All three digits identical (000, 111, ..., 999) | 10 panels | 4.55% ($10/220$) |
| TOTAL SAMPLE SPACE | All Ascending Triads | Sum of all valid combinatoric configurations | 220 panels | 100.00% |
The Sum Modulo 10 Rule
The 3-digit Pana is added together to generate the Single Ank (Single Digit): $$\text{Pana } (1, 2, 4) \implies 1 + 2 + 4 = 7 \implies \text{Open Ank } = 7$$ $$\text{Pana } (5, 6, 9) \implies 5 + 6 + 9 = 20 \implies \text{Modulo 10} = 0 \implies \text{Open Ank } = 0$$
Because each digit from 0 through 9 is produced by an equal distribution of the 220 Panas (each digit has exactly 22 corresponding Panas in the master book: 12 SPs, 9 DPs, and 1 TP), the distribution of Single Anks is completely uniform: exactly 10% per digit.
3. The Complete Odds & Payout Master Matrix
Below is the definitive mathematical breakdown of all wager categories available across standard markets documented on Sara 567:
| Bet Category | Selection Mechanics | Total Sample Space ($N$) | True Odds ($1 \text{ in } N$) | Commercial Payout Multiplier | Implied Return on ₹100 | Expected Value ($EV$) per ₹100 | Operator Margin |
|---|---|---|---|---|---|---|---|
| Single Ank (Open/Close) | Pick 1 digit (0 to 9) | 10 | 1 in 10 (10%) | 9 : 1 (₹90 per ₹10) | ₹1,000 | -₹10.00 | 10.0% |
| Single Ank (High Rate) | Pick 1 digit (0 to 9) | 10 | 1 in 10 (10%) | 9.5 : 1 (₹95 per ₹10) | ₹1,050 | -₹5.00 | 5.0% |
| Jodi (Bracket) | Pick 2 digits (00 to 99) | 100 | 1 in 100 (1%) | 90 : 1 (₹900 per ₹10) | ₹10,000 | -₹10.00 | 10.0% |
| Jodi (High Rate) | Pick 2 digits (00 to 99) | 100 | 1 in 100 (1%) | 95 : 1 (₹950 per ₹10) | ₹10,500 | -₹5.00 | 5.0% |
| Single Pana (SP) | Pick 1 SP out of 120 | 220 total space | 1 in 220 (0.45%) | 140 : 1 (₹1400 per ₹10) | ₹15,000 | -₹35.91 | 35.9% |
| Double Pana (DP) | Pick 1 DP out of 90 | 220 total space | 1 in 220 (0.45%) | 280 : 1 (₹2800 per ₹10) | ₹29,000 | -₹35.91 | 35.9% |
| Triple Pana (TP) | Pick 1 TP out of 10 | 220 total space | 1 in 220 (0.45%) | 700 : 1 (₹7000 per ₹10) | ₹71,000 | -₹67.73 | 67.7% |
| Half Sangam (Pana + Ank) | 1 Open Pana + 1 Close Ank | 2,200 | 1 in 2,200 (0.045%) | 1,000 : 1 | ₹1,00,100 | -₹54.55 | 54.5% |
| Full Sangam (2 Panas) | 1 Open Pana + 1 Close Pana | 48,400 ($220 \times 220$) | 1 in 48,400 (0.002%) | 10,000 : 1 | ₹10,00,100 | -₹79.34 | 79.3% |
[!IMPORTANT] Key Mathematical Insight: Notice how the operator margin expands dramatically as the payout multiplier increases! While a Single Ank or Jodi carries an operator edge of only 5% to 10%, exotic bets like Triple Pana and Full Sangam impose staggering operator edges of 67% to 79%. Mathematically, chasing exotic multipliers is the fastest route to capital depletion.
4. Deconstructing Every Wager Type
Let us examine the operational realities of each wager classification to understand why payout structures are designed this way:
1. Single Ank (The Baseline Asset)
- Mechanics: You select an individual digit from
0through9for either the Open session or the Close session. - Probability: Exactly $\frac{1}{10} = 10%$.
- Standard Payout: ₹90 to ₹95 returned on a ₹10 stake (net gain of ₹80 to ₹85).
- Strategic Utility: Because the house edge is minimal (5% to 10%), professional data analysts use Single Anks as their primary anchor for Bankroll Preservation. Variance is relatively low; a non-hitting streak rarely extends beyond 15 to 20 sessions for a disciplined unit bettor.
2. Jodi / Bracket (The Core Equilibrium)
- Mechanics: You select the complete two-digit outcome from
00through99. The first digit reflects the Open Ank; the second digit reflects the Close Ank. - Probability: Exactly $\frac{1}{100} = 1%$.
- Standard Payout: ₹900 to ₹950 returned on a ₹10 stake (net profit ₹890 to ₹940).
- Red Jodis: As explained in our Jodi Reading Guide, when both digits are identical (
11,22,33) or cut counterparts (16,27,38), the probability remains identical ($1%$), though payout rates never change.
3. Single Pana (SP) & Double Pana (DP)
- Mechanics: Wagering on the specific 3-digit combination that will be declared.
- Sample Space Realities: While there are 120 unique SPs and 90 unique DPs, they are drawn from a shared universe of 220 valid triads.
- Payout Disparity: Single Panas pay
140:1to150:1, whereas Double Panas pay280:1to300:1. The higher payout on Double Panas does not reflect a lower probability of that specific panel (any individual DP has the exact same $1/220$ probability as an individual SP); rather, it reflects the fact that as an entire category, DPs appear less frequently ($40.9%$ vs $54.5%$).
4. Triple Pana (TP: The Lottery Outlier)
- Mechanics: Wagering on all three digits being identical (
000,111,222, ...,999). - Probability: There are only 10 Triple Panas in existence. The probability of any draw producing a Triple Pana is $\frac{10}{220} = 4.55%$. However, the probability of hitting a specific Triple Pana (e.g.,
777) is $\frac{1}{220} \approx 0.45%$. - The Payout Trap: Operators typically pay
600:1to700:1on Triple Panas. If the game paid fair mathematical odds against the general population of numbers, it would pay significantly higher. This makes Triple Pana a massive revenue generator for house operators.
5. Sangam & Half Sangam (The High-Variance Extravaganza)
- Half Sangam: Matches one complete Pana and the opposite Ank (e.g., Open Pana
124+ Close Ank8). Sample space: $220 \times 10 = 2,200$. Payout:1,000:1to1,400:1. - Full Sangam: Matches the exact Open Pana and Close Pana simultaneously (e.g.,
124 - 459). Sample space: $220 \times 220 = 48,400$. Payout:10,000:1to14,000:1. - Mathematical Reality: With a true probability of 1 in 48,400 and a payout of only 10,000:1, the house edge is an astounding 79.3%. Over long runs, wagers on Full Sangam forfeit nearly 80 paise of every single Rupee staked to operator advantage.
5. The Concept of Expected Value (EV) & Operator Margin
In statistical mathematics, the quality of a wager is evaluated through Expected Value ($EV$). Expected Value tells you what you can expect to win or lose on average per bet over thousands of iterations.
The mathematical formula for Expected Value is: $$EV = (P_{\text{win}} \times \text{Net Profit}) - (P_{\text{loss}} \times \text{Stake})$$
Mathematical Walkthrough: Single Ank (At 9:1 Payout)
Let us calculate the $EV$ for a ₹100 wager on a Single Ank paying 9:1:
- Probability of Winning ($P_{\text{win}}$) = $1/10 = 0.10$
- Net Profit on Win = $₹100 \times 9 = ₹900$
- Probability of Losing ($P_{\text{loss}}$) = $9/10 = 0.90$
- Stake Lost = $₹100$
$$EV = (0.10 \times 900) - (0.90 \times 100)$$ $$EV = 90 - 90 = 0 \text{ ? Wait!}$$ Correction: If the total payout is 9:1 (meaning you receive ₹900 total, which is ₹800 net profit + ₹100 original stake returned, as in "10 ka 90"): $$EV = (0.10 \times 800) - (0.90 \times 100) = 80 - 90 = -₹10.00$$
Every time you place a ₹100 bet on a standard Single Ank, your mathematical expectation is to lose exactly ₹10.00. This ₹10 loss represents a -10.0% House Edge.
| Bet Category | Stake Amount | Probability of Win | Winning Net Payout | Calculated Expected Value ($EV$) | Operator Advantage (%) |
|---|---|---|---|---|---|
| Single Ank (9:1) | ₹100 | 10.00% | ₹800 net | -₹10.00 | 10.0% |
| Single Ank (9.5:1) | ₹100 | 10.00% | ₹850 net | -₹5.00 | 5.0% |
| Jodi (90:1) | ₹100 | 1.00% | ₹8,900 net | -₹10.00 | 10.0% |
| Jodi (95:1) | ₹100 | 1.00% | ₹9,400 net | -₹5.00 | 5.0% |
| Single Pana (140:1) | ₹100 | 0.4545% | ₹13,900 net | -₹36.82 | 36.8% |
| Double Pana (280:1) | ₹100 | 0.4545% | ₹27,900 net | -₹36.82 | 36.8% |
| Triple Pana (700:1) | ₹100 | 0.4545% | ₹69,900 net | -₹68.18 | 68.2% |
| Full Sangam (10,000:1) | ₹100 | 0.00206% | ₹9,99,900 net | -₹79.34 | 79.3% |
6. Long-Term Capital Decay: The Compounding Cost of the Edge
Many participants fail to understand why small percentage margins matter. They think: "If the edge is only 5% or 10%, I can easily outsmart it with chart analysis!"
However, in probability theory, the Law of Large Numbers dictates that as the sample size of bets increases, actual results inevitably converge toward the theoretical Expected Value.
Let us simulate what happens to a ₹10,000 bankroll over 1,000 consecutive wagers across different bet classifications:
| Wager Classification | Initial Bankroll | After 100 Bets | After 500 Bets | Final State (1,000 Bets) | Decay Velocity |
|---|---|---|---|---|---|
| Single Ank (5% Edge) | ₹10,000 | ₹9,500 | ₹7,500 | ₹5,000 | Slow, linear erosion |
| Jodi (10% Edge) | ₹10,000 | ₹9,000 | ₹5,000 | ₹0 (Liquidated) | Moderate decay |
| Single Pana (36% Edge) | ₹10,000 | ₹6,400 | ₹0 (Liquidated) | ₹0 (Liquidated) | Rapid capital depletion |
| Full Sangam (79% Edge) | ₹10,000 | ₹2,100 | ₹0 (Liquidated) | ₹0 (Liquidated) | Catastrophic instant ruin |
| Number of Bets Placed | Cumulative Wager Volume | Capital Remaining: Single Ank (5% Edge) | Capital Remaining: Jodi (10% Edge) | Capital Remaining: Single Pana (36% Edge) |
|---|---|---|---|---|
| 10 Bets | ₹1,000 | ₹9,950 | ₹9,900 | ₹9,640 |
| 50 Bets | ₹5,000 | ₹9,750 | ₹9,500 | ₹8,200 |
| 100 Bets | ₹10,000 | ₹9,500 | ₹9,000 | ₹6,400 |
| 250 Bets | ₹25,000 | ₹8,750 | ₹7,500 | ₹1,000 (Critical) |
| 500 Bets | ₹50,000 | ₹7,500 | ₹5,000 | ₹0 (Liquidated) |
| 1,000 Bets | ₹1,00,000 | ₹5,000 | ₹0 (Liquidated) | ₹0 (Liquidated) |
The Critical Takeaway
- High-frequency betting on wide-margin products (Panas, Sangams) guarantees mathematically certain capital liquidation.
- If one participates for entertainment or statistical tracking, confining activity to low-edge markets (Single Anks or Jodis at 95:1) dramatically prolongs bankroll life and lowers the "cost of play."
7. Mathematical Risk Management: Kelly Criterion vs. Fixed Units
In professional quantitative finance, investors use sizing formulas to prevent bankruptcy when dealing with probabilistic uncertainty. Two popular frameworks are the Kelly Criterion and the Fixed Unit Rule:
1. The Kelly Criterion
The Kelly Criterion calculates the mathematically optimal fraction of bankroll ($f^$) to wager: $$f^ = \frac{b \cdot p - q}{b}$$ Where:
- $b$ = decimal payout minus 1
- $p$ = probability of winning
- $q$ = probability of losing ($1 - p$)
In negative-expectation games where the house edge is greater than zero ($b \cdot p < q$), the Kelly formula produces a negative number. Mathematically, a negative Kelly fraction gives an unambiguous instruction: Do not bet, or bet zero.
2. The 1% Fixed Unit Protocol
For recreational participants who choose to engage with numerical markets on platforms like Sara 567, the only mathematical defense against variance is the Strict 1% Unit Rule:
| Total Entertainment Bankroll | Recommended 1 Unit (1.0%) | Maximum Daily Exposure (3 Units) | Strict Stop-Loss Circuit Breaker |
|---|---|---|---|
| ₹5,000 | ₹50 | ₹150 per day | Stop immediately after -₹150 loss |
| ₹10,000 | ₹100 | ₹300 per day | Stop immediately after -₹300 loss |
| ₹25,000 | ₹250 | ₹750 per day | Stop immediately after -₹750 loss |
| ₹50,000 | ₹500 | ₹1,500 per day | Stop immediately after -₹1,500 loss |
By capping maximum daily exposure at 3% of total allocated entertainment capital, you ensure that even a severe 10-session statistical non-hitting streak consumes less than 30% of your bankroll, completely eliminating the risk of catastrophic overnight ruin.
8. Frequently Asked Questions (Odds & Payouts FAQ)
Q1: Why do some bookmakers offer "10 ka 95" while others offer "10 ka 90"?
Answer: Payout rates vary based on competition and operator overhead. Modern cloud platforms with automated digital operations often pass savings to users by offering 95:1 on Jodis (a 5% house edge), whereas traditional brick-and-mortar operators with physical agent commissions offer 90:1 (a 10% house edge).
Q2: Is it mathematically better to bet on 5 Single Anks or 1 Jodi?
Answer: Betting on 5 Single Anks gives you a 50% probability of hitting one digit, paying 9:1 or 9.5:1. Betting on 1 Jodi gives you a 1% probability of hitting, paying 90:1 or 95:1. While both bets have an identical house edge (typically 5% to 10%), the 5 Single Anks exhibit vastly lower variance, resulting in a much smoother bankroll trajectory.
Q3: What is the highest paying bet in Satta Matka?
Answer: The Full Sangam (matching the Open Pana and Close Pana simultaneously) is the highest paying bet, offering payouts between 10,000:1 and 14,000:1. However, with true mathematical odds of 1 in 48,400, it carries the most brutal operator edge in the entire industry (nearly 80%).
Q4: Can any betting system (like Martingale) overcome the house edge?
Answer: No. Proven mathematically by mathematician Richard von Mises, no staking strategy or progression system can convert negative expected value (-EV) trials into positive expected value (+EV). The Martingale system (doubling bets after losses) merely converts frequent small wins into rare, catastrophic total liquidations.
Q5: Where can I track verified live results and charts?
Answer: You can follow verified, real-time market outcomes and 52-week historical archives directly on Sara 567, featuring sub-50ms WebSocket updates and comprehensive Jodi and Pana records.
Conclusion: Replace Emotion with Mathematics
The difference between reckless speculation and disciplined observation is an understanding of the numbers. Payout multipliers are carefully calibrated mathematical constructs designed to reward the house over volume.
By mastering the true odds, calculating Expected Value, avoiding high-edge exotic bets like Triple Panas and Sangams, and enforcing strict 1% unit bankroll caps, you protect your capital and navigate numerical markets with analytical clarity.
Explore our comprehensive Historical Charts, master Pana Reading, and follow verified results on Sara 567.
Full stack developer and marketing expert specializing in scalable web architecture, SEO optimization, and data-driven analytics for digital platforms.