
Reading Jodi Charts Like a Pro: Step-by-Step Analysis & Historical Pattern Guide
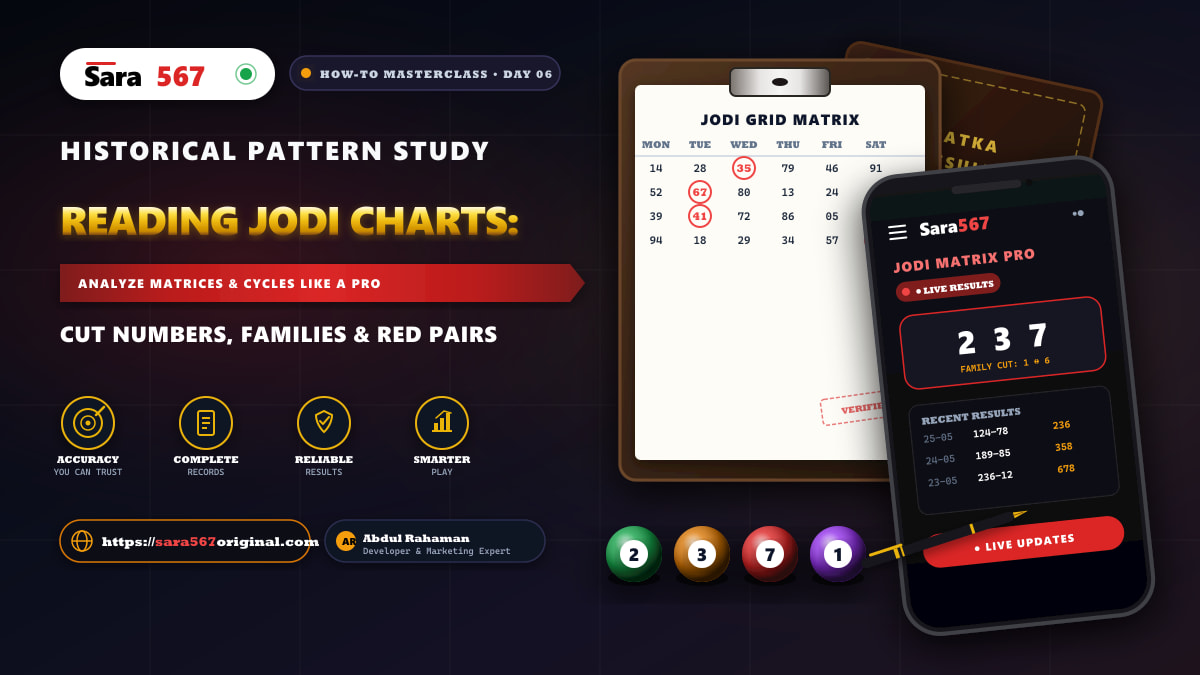
Reading Jodi Charts Like a Pro: Step-by-Step Analysis & Historical Pattern Guide
To the uninitiated observer, a Satta Matka Jodi chart appears as an overwhelming grid of two-digit numbers, punctuated randomly by crimson-red cells and chronological dates. Yet, for seasoned market researchers and historical statisticians, mastering how to read jodi chart records is the foundational skill that separates disciplined data tracking from uninformed guesswork.
A jodi chart analysis is not about peering into a crystal ball or searching for mythical "guaranteed" formulas. Rather, it is the systematic study of chronological probability distributions. It maps how single-digit Open Anks and Close Anks merge to form two-digit pairs (00 to 99), highlights mathematical symmetries known as "Cut numbers," and flags special harmonic conditions known across the industry as "Red Jodis."
At Sara 567 (sara567original.com), we maintain verified, millisecond-accurate historical charts across all major markets, including Kalyan Matka, Milan Day, Rajdhani Night, and Time Bazar. In this comprehensive tutorial, we break down the exact anatomy of a Jodi chart, teach you how to decode calendar grids, explore family number groups, and guide you in evaluating historical data with analytical rigor.
Table of Contents
- What Exactly Is a Satta Matka Jodi Chart?
- The Anatomy of a Jodi: How Open & Close Anks Merge
- Decoding the Grid Layout: Days, Weeks & Calendar Cycles
- The Cut Number Principle: The Core Mathematical Symmetry
- What Is a "Red Jodi"? Full Red vs. Half Red Decoded
- Family Jodis: The 8-Combination Symmetric Set
- Step-by-Step Tutorial: Reading a Live Chart on Sara 567
- Jodi Chart vs. Panel Chart: Key Differences
- Common Analytical Pitfalls and Misconceptions
- Frequently Asked Questions (FAQs)
- Responsible Gaming & Analytical Ethics
What Exactly Is a Satta Matka Jodi Chart?
A satta matka jodi chart is a two-dimensional chronological record tracking the final two-digit outcomes of a specific market over days, weeks, months, and years.
Unlike a Panel Chart—which documents the three-digit card draws (Pana) for both the Open and Close sessions alongside the Jodi—a Jodi Chart focuses exclusively on the resulting pairs. This condensed format provides a streamlined macroscopic view, making it easier to evaluate digit frequencies, column cycles, and recurring numerical relationships without the visual clutter of six additional Pana digits.
| Week Commencing | Monday | Tuesday | Wednesday | Thursday | Friday | Saturday | Sunday |
|---|---|---|---|---|---|---|---|
| 2026-10-05 | 45 | 78 | [22] | 90 | 31 | 64 | — |
| 2026-10-12 | 18 | 52 | 83 | [77] | 06 | 49 | — |
| 2026-10-19 | 93 | [38] | 14 | 65 | [88] | 27 | — |
> Note: Bracketed bold values indicate Red Jodis (matching digits such as 22, 77, 88 or cut family pairs such as 38).
In the mathematical universe of Satta Matka, there are exactly 100 possible Jodi combinations, spanning from 00, 01, 02 through 99. Each individual combination carries an identical theoretical probability of 1 in 100 (1%) on any given independent draw.
The Anatomy of a Jodi: How Open & Close Anks Merge
To read a Jodi chart accurately, you must first understand how each two-digit pair is synthesized during a market's operational cycle. Every standard regular market operates in two distinct sessions:
- The Open Session: Draws three numbers (Pana), sums them, takes the terminal units digit, and declares the Open Ank.
- The Close Session: Conducts an identical calculation several hours later to declare the Close Ank.
The Jodi is simply the concatenation of the Open Ank (Tens digit) and the Close Ank (Units digit):
$$\text{Jodi} = (\text{Open Ank} \times 10) + \text{Close Ank}$$
| Market Phase | Pana Drawn | Sum of Pana | Unit Digit Calculation | Resulting Ank | Jodi Formation |
|---|---|---|---|---|---|
| Open Session | 1-4-9 | $1 + 4 + 9 = 14$ | Last digit of $14$ is $4$ | Open Ank = 4 | First digit: 4_ |
| Close Session | 2-5-8 | $2 + 5 + 8 = 15$ | Last digit of $15$ is $5$ | Close Ank = 5 | Second digit: _5 |
| Final Result | 149-45-258 | — | — | — | Final Jodi = 45 |
On a Jodi chart, only the central number 45 is recorded for that date. The outer Panas (149 and 258) are archived separately in the market's Panel chart.
Decoding the Grid Layout: Days, Weeks & Calendar Cycles
Every standard Jodi chart hosted on Sara 567 follows a rigorous calendar grid structure designed for intuitive horizontal and vertical cross-referencing:
1. Horizontal Reading (Weekly Rows)
Each horizontal row represents a complete operational calendar week (typically Monday through Friday, Saturday, or Sunday, depending on whether the market operates 5, 6, or 7 days).
- Reading horizontally shows the chronological progression of numbers as they were declared day by day.
- Analysts often look at horizontal rows to observe whether a given week exhibited high or low digit sums.
2. Vertical Reading (Day Columns)
Each vertical column aligns all historical outcomes that occurred on that specific day of the week (e.g., all historical Monday results).
- Analysts scrutinize vertical columns to assess day-specific clustering—such as whether a specific market has historically favored odd Anks on Wednesdays or even Anks on Fridays over recent months.
3. Diagonal and Line Cross-Referencing
Advanced chart students frequently observe diagonal trajectories across consecutive weeks. While each draw remains an independent random event, tracking diagonal alignments helps identify whether consecutive outcomes reflect alternating digit sequences.
The Cut Number Principle: The Core Mathematical Symmetry
You cannot read a Jodi chart like a professional without understanding the Cut Number (also called Opposite Number or Family Ank).
In Indian matka arithmetic, digits operate on a base-10 modulo-5 symmetry. Every digit between 0 and 9 has a designated opposite digit located exactly 5 units away:
$$\text{Cut Digit} = (\text{Base Digit} + 5) \pmod{10}$$
| Original Digit | Mathematical Cut Operation | Resulting Cut Digit | Symmetric Pair |
|---|---|---|---|
| 0 | $0 + 5$ | 5 | 0 ↔ 5 |
| 1 | $1 + 5$ | 6 | 1 ↔ 6 |
| 2 | $2 + 5$ | 7 | 2 ↔ 7 |
| 3 | $3 + 5$ | 8 | 3 ↔ 8 |
| 4 | $4 + 5$ | 9 | 4 ↔ 9 |
Why Cut Numbers Matter in Jodi Interpretation:
When you see a Jodi like 16 or 38, experienced analysts do not view them as arbitrary numbers. They immediately identify that the Close Ank is the exact Cut Digit of the Open Ank. This mathematical relationship is the basis for identifying Red Jodis.
What Is a "Red Jodi"? Full Red vs. Half Red Decoded
When browsing any authentic Jodi chart on Sara 567, you will immediately notice that certain two-digit numbers are printed in bold red font or enclosed within distinct red highlight cells.
In matka terminology, a Red Jodi (Lal Jodi) refers to a pair where the Open Ank and Close Ank share a direct identity or a Cut relationship. Red Jodis fall into two distinct classifications:
| Red Jodi Category | Mathematical Rule | Total Pairs | Complete Combination Set | Occurrence Probability |
|---|---|---|---|---|
| Full Red Jodi | Open Ank = Close Ank ($A = B$) | 10 | 00, 11, 22, 33, 44, 55, 66, 77, 88, 99 | 10% |
| Half Red Jodi | Close Ank = Cut of Open Ank ($B = (A+5) \pmod{10}$) | 10 | 05, 50, 16, 61, 27, 72, 38, 83, 49, 94 | 10% |
| Combined Red Universe | Any identity or cut relationship | 20 | Full Red + Half Red combinations | 20% (1 in 5 draws) |
1. Full Red Jodi (Matching Digits)
A Full Red Jodi occurs when both the Open Ank and Close Ank are identical digits. There are exactly 10 Full Red Jodis in the entire 100-number matrix:
00,11,22,33,44,55,66,77,88,99
2. Half Red Jodi (Cut Pairs)
A Half Red Jodi occurs when the Open Ank and Close Ank are distinct, but one digit is the exact Cut of the other. There are exactly 10 Half Red Jodis:
05and50(0 and 5 are cut pairs)16and61(1 and 6 are cut pairs)27and72(2 and 7 are cut pairs)38and83(3 and 8 are cut pairs)49and94(4 and 9 are cut pairs)
Total Red Jodis in the Grid:
Together, Full Red (10) and Half Red (10) account for exactly 20 out of 100 possible Jodis (20% of the entire probability field). The remaining 80 combinations are recorded in standard black or white typography and are termed Normal Jodis.
| Red Jodi Classification | Definition | Complete Set of Combinations | Total Count | Grid Probability |
|---|---|---|---|---|
| Full Red | $\text{Open} = \text{Close}$ | 00, 11, 22, 33, 44, 55, 66, 77, 88, 99 | 10 | 10% |
| Half Red | $\text{Close} = \text{Cut}(\text{Open})$ | 05, 50, 16, 61, 27, 72, 38, 83, 49, 94 | 10 | 10% |
| Combined Red Field | Any harmonic identity | Both groups combined | 20 | 20% |
| Normal Jodi | Independent Anks | All other combinations (e.g., 45, 82, 19) | 80 | 80% |
When reading a Jodi chart, noticing a cluster of Red Jodis across consecutive days indicates a high-harmonic cycle, whereas long spans with zero Red Jodis reflect extended normal-distribution variance.
Family Jodis: The 8-Combination Symmetric Set
Another essential concept employed by chart analysts is the Family Jodi (or Jodi Family). A Jodi family is a group of related two-digit numbers derived by substituting one or both digits with their corresponding Cut numbers, along with their inverted reversals.
For any non-red base Jodi (such as 14), its complete family consists of exactly 8 symmetric combinations:
- Original Base Jodi:
14 - Reverse Jodi (Palat):
41 - Open Cut Jodi: Substitute Open digit with its Cut ($1 \to 6$) $\implies$
64 - Open Cut Reverse:
46 - Close Cut Jodi: Substitute Close digit with its Cut ($4 \to 9$) $\implies$
19 - Close Cut Reverse:
91 - Full Cut Jodi: Substitute both digits with their Cuts ($1 \to 6$, $4 \to 9$) $\implies$
69 - Full Cut Reverse:
96
Thus, the complete Family of 14 is the 8-number set:
$$\mathcal{F}(14) = { 14, 41, 19, 91, 46, 64, 69, 96 }$$
| Base Jodi | Digit 1 Cut ($+5$) | Digit 2 Cut ($+5$) | Complete 8-Jodi Family Group |
|---|---|---|---|
| 12 | $1 \to 6$ | $2 \to 7$ | 12, 21, 17, 71, 26, 62, 67, 76 |
| 13 | $1 \to 6$ | $3 \to 8$ | 13, 31, 18, 81, 36, 63, 68, 86 |
| 14 | $1 \to 6$ | $4 \to 9$ | 14, 41, 19, 91, 46, 64, 69, 96 |
| 23 | $2 \to 7$ | $3 \to 8$ | 23, 32, 28, 82, 37, 73, 78, 87 |
| 24 | $2 \to 7$ | $4 \to 9$ | 24, 42, 29, 92, 47, 74, 79, 97 |
| 34 | $3 \to 8$ | $4 \to 9$ | 34, 43, 39, 93, 48, 84, 89, 98 |
(Note: For Red Jodis like 22 or 27, identical digit overlaps reduce the total family count from 8 down to 4 combinations: 22, 77, 27, 72.)
Professional analysts use family groups to categorize historical occurrences. If a chart exhibits frequent outcomes within the same 8-number family across a 3-week span, it signals an active digit group for that specific market.
Step-by-Step Tutorial: Reading a Live Chart on Sara 567
Follow this four-step procedure whenever inspecting historical Jodi records on the Sara 567 Charts Directory:
| Step | Analysis Phase | Objective | Practical Output / Action |
|---|---|---|---|
| Step 1 | Market & Horizon Selection | Choose target market and set 30 to 90-day window | Isolates clean sample without multi-market noise |
| Step 2 | Date Grid Scanning | Review daily transitions from Monday to Saturday | Tracks high vs low digit registers and momentum |
| Step 3 | Red Jodi & Cut Identification | Highlight Full Red and Half Red occurrences | Evaluates harmonic cycle density vs 20% mean |
| Step 4 | Cross-Referencing Panel | Audit Open and Close Anks against declared Panas | Verifies tamper-proof mathematical consistency |
Step 1: Select Your Market & Horizon
Navigate to the market of interest (e.g., Kalyan Jodi Chart or Milan Night Jodi Chart). Select a reasonable historical horizon—typically 30 to 90 days. Avoid evaluating single-week samples in isolation, as short-term variance produces misleading anomalies.
Step 2: Scan the Chronological Rows
Locate the current week at the top or bottom of the grid. Review how numbers transitioned day by day. Note whether the week opened with high digits (5 through 9) or low digits (0 through 4).
Step 3: Identify Red Jodis & Cut Symmetries
Look for highlighted red cells. Count how many Red Jodis appeared over the past 4 weeks. In a standard 24-day operational month (6 days/week), the theoretical expected count of Red Jodis is:
$$\mathbb{E}[\text{Red Jodis}] = 24 \times 0.20 = 4.8 \approx 5 \text{ Red Jodis per month}$$
If a chart displays 8 or 9 Red Jodis in a month, that period experienced an elevated harmonic density. Conversely, if only 1 or 2 appeared, the market was running below its long-term average.
Step 4: Cross-Reference with Panel Records
If a specific Jodi warrants deeper investigation, switch to that market's Panel Chart (e.g., Kalyan Pana Chart). Check whether the Jodi was formed by Single Panas (three distinct digits like 128), Double Panas (a pair like 224), or Triple Panas (333).
Jodi Chart vs. Panel Chart: Key Differences
Understanding when to consult a Jodi chart versus a Panel chart is essential for efficient research:
| Comparison Criterion | Jodi Chart | Panel (Pana) Chart |
|---|---|---|
| Data Displayed | Solitary 2-digit pairs (45) | Full triad: Open Pana (149) + Jodi (45) + Close Pana (258) |
| Visual Density | Clean, minimalist grid | Information-dense, large tabular layout |
| Primary Use Case | Tracking digit frequencies, Cut relationships, Red Jodis | In-depth card combination research, Pana family tracking |
| Screen Suitability | Highly responsive on mobile screens | Best viewed on wide desktop or tablet displays |
| Probability Scale | 1 in 100 combinations | 1 in 1,000 combinations per session |
| Availability on Sara 567 | Dedicated market Jodi routes (/jodi/*) | Dedicated market Pana routes (/pana/*) |
Common Analytical Pitfalls and Misconceptions
When reading Jodi charts, beginners frequently fall prey to psychological cognitive biases. Recognizing these pitfalls is crucial:
1. The Gambler's Fallacy
Believing that because a specific number or Red Jodi has not appeared for 30 consecutive draws, it is "overdue" and guaranteed to appear soon. In mathematically independent draws, previous outcomes do not alter future probabilities. Every Jodi retains an identical 1% probability on every fresh draw.
2. Mistaking Correlation for Causation
Observing that Monday produced 45 and Tuesday produced 54 in one specific week does not mean the reverse Jodi will automatically appear every Tuesday. Coincidental repetitions are natural byproducts of random variance across 100-number sets.
3. Relying on Unverified Chart Archives
Numerous unauthenticated websites retroactively modify older chart entries to create false illusions of predictive accuracy. Always rely on Sara 567, where historical archives are locked with timestamped server logs.
Frequently Asked Questions (FAQs)
Q1: What does a red number mean on a Satta Matka Jodi chart?
A red number indicates a Red Jodi. This occurs either when both digits of the Jodi are identical (Full Red, such as 22, 77, 88) or when one digit is the exact mathematical Cut (opposite) of the other (Half Red, such as 27, 38, 49). Red Jodis comprise exactly 20 out of the 100 possible pairs.
Q2: How many Jodi combinations are possible in total?
There are exactly 100 possible Jodi combinations, spanning from 00 through 99. Each combination has an equal theoretical probability of 1 in 100 (1%) on any independent draw.
Q3: What is the formula for calculating Cut digits?
The Cut digit is calculated by adding 5 to any base digit between 0 and 9 and taking the modulo 10 (or simply flipping across the 5-point axis): 0↔5, 1↔6, 2↔7, 3↔8, 4↔9.
Q4: How many numbers make up a Jodi Family?
For standard (non-red) pairs, a Jodi family comprises exactly 8 combinations, formed by taking the original pair, its reverse, and substituting each digit with its Cut number. For Red Jodis, identical digit overlaps reduce the family set to 4 combinations.
Q5: Can studying historical Jodi charts guarantee future outcomes?
No. Historical charts are retrospective data logs designed to track past outcomes, evaluate frequency distributions, and verify historical records. Because draws are independent events, historical charts cannot guarantee or predict future outcomes with mathematical certainty.
Responsible Gaming & Analytical Ethics
Satta Matka historical records should strictly be viewed through an objective, analytical, and cultural lens.
- Data Tracking Only: Use charts for historical verification and educational understanding.
- Strict Financial Discipline: Never risk money meant for personal living, medical, or family requirements.
- Emotional Detachment: Never let chart observations drive compulsive behavior. If numerical tracking causes stress or anxiety, disengage immediately and seek guidance from professional responsible gaming support services.
Explore More Analysis Guides on Sara 567
Deepen your understanding with our companion guides:
- Kalyan Matka Complete Guide: Timings, Charts & Strategies
- Milan Day & Night Analysis: Pattern Recognition & Historical Charts
- Rajdhani Day vs Night: Timings, Market Differences & Chart Comparison
- Time Bazar Strategy Guide: Timings & Panel Patterns
- Regional Satta Matka Variants: Gali & Disawar Overview
- Complete Satta Matka Charts Directory
Full stack developer and marketing expert specializing in scalable web architecture, SEO optimization, and data-driven analytics for digital platforms.