
How to Create a Betting Strategy: A Data-Driven Framework for Satta Matka
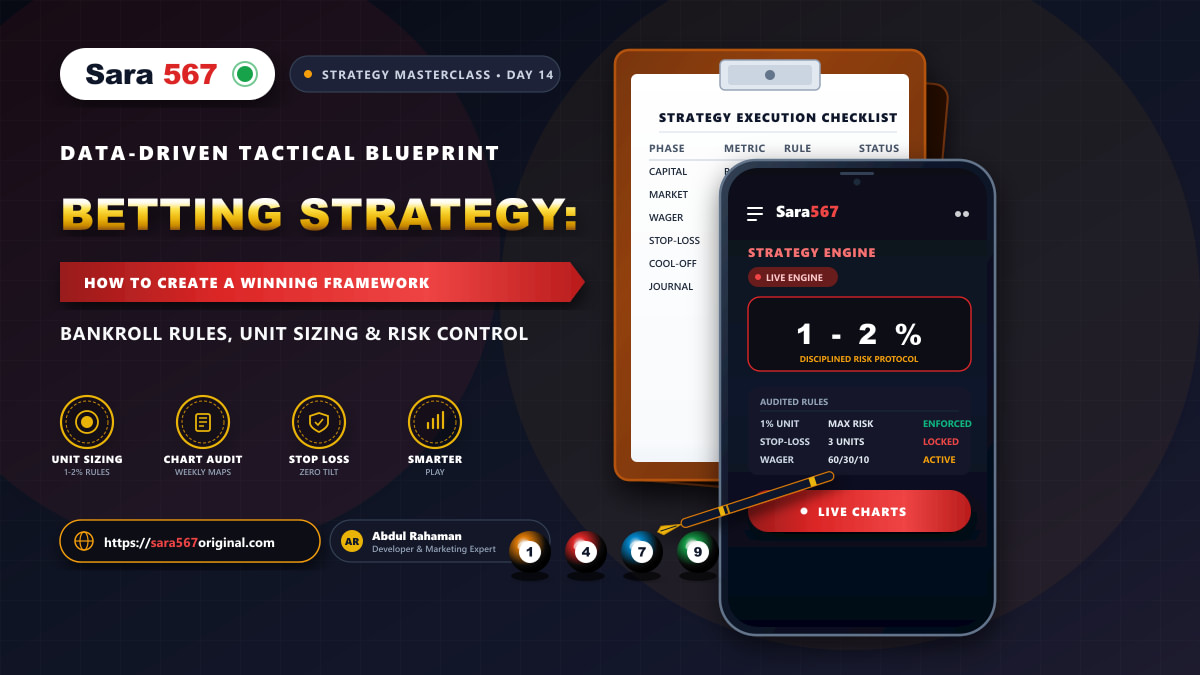
How to Create a Betting Strategy: A Data-Driven Framework for Satta Matka
In the fast-moving world of Indian numerical markets, the overwhelming majority of participants operate entirely on raw emotion, intuition, superstitious dreams, or unverified tips from opportunistic social media channels. The predictable result is erratic capital allocation, sudden drawdowns, emotional tilt, and eventual total bankroll depletion.
Conversely, serious market researchers, professional sports analysts, and financial quantitative traders never approach any probabilistic system without a systematic, pre-defined operational strategy. A true betting strategy does not promise magical clairvoyance or guaranteed wins—mathematically, each draw remains an independent, memoryless random event governed by combinatorial odds. Instead, an elite strategy creates a disciplined risk management structure that preserves capital, eliminates emotional decision-making, and allows you to analyze verified data with complete emotional detachment.
In this masterclass, we present a complete, step-by-step engineering blueprint to design, stress-test, and execute a data-driven betting strategy for Satta Matka markets using the verified charts and real-time declaration engine of Sara 567.
Table of Contents
- The Foundational Paradigm: Gambler vs Strategic Analyst
- Phase 1: Capital Architecture & The 1% Unit Sizing Rule
- Phase 2: Market Specialization & Schedule Alignment
- Phase 3: Wager Type Allocation (Single Ank, Jodi & Pana)
- Phase 4: The 5-Step Chart Auditing Routine
- Phase 5: Loss Mitigation Protocols & Circuit Breakers
- Phase 6: The Quantitative Strategy Journal
- Phase 7: Cognitive Hygiene & Eradicating Emotional Tilt
- How Sara 567 Serves as Your Strategic Analytical Engine
- Frequently Asked Questions (FAQs)
- Responsible Gaming & Analytical Ethics
The Foundational Paradigm: Gambler vs Strategic Analyst
Before writing a single calculation or examining a single chart, you must understand the psychological divide between recreational speculation and structured strategic analysis.
The recreational participant approaches the market seeking immediate thrills and dopamine spikes. They bet haphazard sums based on morning moods, double down when losing to "break even," and celebrate winning streaks as personal brilliance rather than normal statistical variance.
The strategic analyst views the market as a laboratory of combinatorics, probability laws, and risk-adjusted capital preservation. The table below illustrates the contrasting behaviors across the seven core operational pillars:
| Strategic Dimension | Recreational Gambler Mindset | Systematic Strategic Analyst Mindset |
|---|---|---|
| Capital Source | Discretionary personal funds, daily savings, borrowed money | Strictly isolated, disposable entertainment capital reserve |
| Bet Sizing Method | Arbitrary amounts determined by confidence or recent losses | Fixed unit sizing ($1\text{--}2%$ of total bankroll per session) |
| Market Focus | Chases all open markets throughout the morning, day, and night | Focuses on 1 or 2 flagship markets with deep historical data |
| Analytical Basis | "Fix leak" tips, dreams, lucky astrologies, gut instincts | Audited historical chart records, frequency bounds, combinatorics |
| Reaction to Losses | Emotional anger, aggressive chasing, doubling down (Martingale) | Objective stop-loss execution, cool-off period, analytical journal review |
| Winning Response | Excessive euphoria, reckless bet inflation, refusing to bank profits | Methodical profit extraction, strict adherence to base unit allocation |
| Data Verification | Fragmented WhatsApp groups, unverified third-party blogs | Real-time, official, audited records on Sara 567 |
By consciously adopting the analyst mindset, you immediately insulate yourself from the catastrophic pitfalls that claim more than $95%$ of market participants.
Phase 1: Capital Architecture & The 1% Unit Sizing Rule
The single most fatal mistake in numerical wagering is undercapitalization coupled with aggressive bet sizing. If your total allocated entertainment bankroll is ₹10,000 and you wager ₹2,000 on a single Jodi, a mere string of five consecutive negative outcomes eliminates your entire capital pool. In probability theory, this is known as the Risk of Ruin.
The Three-Tier Bankroll Architecture
A professional strategy divides your capital into three distinct, non-fungible compartments:
- The Vault (60% of Total Capital): Stored securely outside the active betting environment. This reserve acts as a shock absorber and is never touched during regular operational sessions.
- The Active Operational Bankroll (30% of Total Capital): The capital dedicated to the current monthly analytical cycle.
- The Session Buffer (10% of Total Capital): The maximum capital accessible during any individual calendar day.
Total Capital Pool (₹20,000)
├── 60% The Vault (₹12,000) ────────── Emergency Reserve / Untouchable
├── 30% Active Bankroll (₹6,000) ───── Monthly Cycle Budget
└── 10% Daily Buffer (₹2,000) ──────── Maximum Single-Day Operational Limit
The 1% to 2% Base Unit Rule
To withstand the natural clustering of adverse variance, your fundamental betting unit must represent between 1% and 2% of your active operational bankroll. Never increase unit sizing during a session based on emotional momentum.
| Total Active Bankroll | Conservative Unit (1.0%) | Balanced Unit (1.5%) | Maximum Aggressive Unit (2.0%) | Consecutive Losses to Deplete 50% |
|---|---|---|---|---|
| ₹5,000 | ₹50 | ₹75 | ₹100 | 50 Sessions |
| ₹10,000 | ₹100 | ₹150 | ₹200 | 50 Sessions |
| ₹25,000 | ₹250 | ₹375 | ₹500 | 50 Sessions |
| ₹50,000 | ₹500 | ₹750 | ₹1,000 | 50 Sessions |
| ₹100,000 | ₹1,000 | ₹1,500 | ₹2,000 | 50 Sessions |
By enforcing a 1% unit size, you guarantee that even a catastrophic anomaly of 20 consecutive non-occurrences depletes less than a fifth of your bankroll, leaving your analytical capacity completely intact. For a comprehensive deep-dive into mathematical risk management, consult our guide on Bankroll Management for Satta Matka.
Phase 2: Market Specialization & Schedule Alignment
A common pathology among novice players is "market hopping." They begin the day at 01:00 PM on Time Bazar, shift to Kalyan at 04:10 PM, follow up with Milan Day at 05:00 PM, and continue through Rajdhani Night and Milan Night until midnight.
This hyperactive routine generates decision fatigue, multiplies transaction friction, and guarantees that you never develop deep familiarity with any single market's historical behavior.
A robust betting strategy demands market specialization. Choose your operational battlefield based on your personal daily schedule, liquidity preferences, and variance tolerance:
| Market Flagship | Operating Window | Weekly Cadence | Liquidity & Volume | Strategic Match |
|---|---|---|---|---|
| Kalyan Matka | 04:10 PM – 06:10 PM | Mon – Sat (6 Days) | Tier 1 (Benchmark) | Ideal for structured, long-term chart pattern analysts who value deep archives. |
| Milan Day & Night | Day: 03:00 PM<br />Night: 09:00 PM | Mon – Sun (7 Days) | Tier 1 (Unbroken) | Suited for analysts who maintain daily tracking routines without weekend interruptions. |
| Rajdhani Day & Night | Day: 03:15 PM<br />Night: 09:35 PM | Mon – Fri (5 Days) | Tier 2 (Capital Focus) | Best for weekday business traders who demand clear weekend boundaries to audit records. |
| Time Bazar | 01:00 PM – 02:00 PM | Mon – Sat (6 Days) | Tier 1 (Rapid Action) | Optimal for midday specialists who prefer a tight, 1-hour resolution window. |
For detailed side-by-side market mechanics, refer to our comparative study: Comparing Different Satta Markets: Kalyan vs Milan vs Rajdhani vs Time Bazar.
Phase 3: Wager Type Allocation (Single Ank, Jodi & Pana)
The Indian numerical system offers three fundamental wager categories, each possessing distinct combinatoric probabilities, payout multipliers, and volatility characteristics. A mature strategy does not treat these formats equally; it establishes a hierarchical capital allocation rule.
1. Single Ank (Open / Close)
- Combinatorial Universe: 10 digits ($0\text{--}9$).
- Theoretical Probability: $1 / 10 = 10%$.
- Standard Payout Ratio: $1:9$ (₹10 yields ₹90).
- Strategic Role: Capital Preservation & Cash-Flow Foundation. Because the probability of an outcome is relatively high ($10%$), Single Ank wagers exhibit smooth variance curves and short drawdown cycles.
2. Jodi (Two-Digit Pair)
- Combinatorial Universe: 100 pairs ($00\text{--}99$).
- Theoretical Probability: $1 / 100 = 1%$.
- Standard Payout Ratio: $1:90$ (₹10 yields ₹900).
- Strategic Role: Core Asymmetric Growth. Jodi wagers generate meaningful returns when an audited pattern aligns, but require broader diversification across multiple complementary pairs (such as Family Jodis or Cut Jodis) to mitigate the $99%$ failure rate of any single number.
3. Pana / Patti (Three-Digit Combination)
- Combinatorial Universe: 220 ascending three-digit combinations (120 Single Panas, 90 Double Panas, 10 Triple Panas).
- Theoretical Probability: Single Pana ($1/220 \approx 0.45%$), Double Pana ($1/220 \approx 0.45%$), Triple Pana ($1/1,000 = 0.1%$).
- Standard Payout Ratio: Single Pana $1:140$, Double Pana $1:280$, Triple Pana $1:600\text{--}1:900$.
- Strategic Role: High-Payout Micro-Allocations. Due to the extreme mathematical rarity of individual Panas, wagers must never exceed fractional units ($0.25\text{--}0.5$ units).
The Strategic Capital Allocation Model
When deploying capital in any given market session, adhere to the 60-30-10 Portfolio Distribution:
| Wager Category | Portfolio Allocation | Target Volatility | Recommended Sizing Per Selection | Role in Strategy |
|---|---|---|---|---|
| Single Ank (Open/Close) | 60% | Low | $1.0\text{--}1.5$ Units | Primary balance builder; cushions drawdowns |
| Jodi Pairs (Cross-Hedging) | 30% | Moderate | $0.5\text{--}0.75$ Units | Asymmetric return generator across correlated pairs |
| Panel / Pana (Speculative) | 10% | Extreme | $0.1\text{--}0.25$ Units | Lottery upside; strictly limited capital exposure |
Session Capital Allocation (100%)
├── 60% Single Ank ──────── Smooth Variance & Bankroll Stability
├── 30% Jodi Combinations ─ Balanced Risk-Reward Expansion
└── 10% Pana Panels ─────── Controlled Micro-Speculation
To master the internal mechanics of three-digit combinations, review our dedicated breakdown on Pana Chart Mastery.
Phase 4: The 5-Step Chart Auditing Routine
A strategy is only as effective as the empirical data feeding it. Instead of blindly trusting rumors or speculative Telegram channels, professional analysts execute an objective 5-Step Weekly Chart Audit using historical records verified on Sara 567 Jodi Charts and Pana Charts.
Step 1: Define the Sample Window ($N = 30$ to $N = 90$ Days)
Never base a strategic hypothesis on yesterday's single outcome. Establish a rolling sample window of at least 30 to 90 historical market days. This sample size is sufficiently large to filter out micro-noise while remaining sensitive to recent structural trends.
Step 2: Frequency Distribution & Ank Mapping
Tabulate how frequently each digit ($0\text{ through }9$) has appeared as an Open Ank and Close Ank over the evaluation window:
- In a perfectly uniform random distribution over 100 draws, each digit has an expected frequency of $\mu = 10$.
- If digit $7$ has appeared only 3 times in 90 draws, it is in a state of statistical latency (cold number).
- If digit $4$ has appeared 19 times in 90 draws, it has exhibited short-term clustering (hot number).
- The Golden Rule: Never assume a cold number is "due" to appear immediately. In independent trials, past non-appearances do not increase future probability (the Gambler's Fallacy). Use frequency maps purely to identify prevailing market momentum.
Step 3: Family Jodi & Cut Number Auditing
Examine whether recent outcomes are clustering within specific mathematical number families. In Indian market theory:
- Every digit has an inverse or Cut Digit separated by modulo 5 ($0 \leftrightarrow 5$, $1 \leftrightarrow 6$, $2 \leftrightarrow 7$, $3 \leftrightarrow 8$, $4 \leftrightarrow 9$).
- If Jodi
27declared on Tuesday, an analyst audits the chart for appearances of its associated family members (72,22,77). - Check our comprehensive guide on Reading Jodi Charts Like a Pro to learn how to map family matrices.
Step 4: Pana Modulo & Sum Total Verification
Calculate the digital root sum of recent Panas. For instance, the Pana 1-3-8 produces a sum of $1 + 3 + 8 = 12$, whose terminal digit is $2$. Identify whether recent Open/Close results show recurring sum parity (Even vs Odd sums) or consecutive panel runs.
Step 5: Synthesize into an Actionable Session Plan
Before the market opens, write down your exact selections, designated unit allocations, and target take-profit/stop-loss boundaries. Once written, the plan is locked. No adjustments are permitted during active declaration hours.
| Audit Phase | Objective | Tools on Sara 567 | Actionable Output |
|---|---|---|---|
| Phase 1: Sampling | Filter noise; isolate active window | Date-Filtered Archive | 60-day chronological dataset |
| Phase 2: Frequency | Map hot vs cold digit distribution | Kalyan Jodi Chart | Tabulated digit frequency matrix |
| Phase 3: Families | Spot recurring family and cut pairings | Milan Day Chart | 3 target correlated Jodi candidate pairs |
| Phase 4: Pana Analysis | Audit single vs double panel prevalence | Kalyan Pana Chart | 2 hedge panel combinations |
| Phase 5: Execution Lock | Prevent spontaneous impulse betting | Private Analytical Journal | Immutable session order ticket |
Phase 5: Loss Mitigation Protocols & Circuit Breakers
The true mark of a master strategist is not how much they win during favorable variance runs, but how effectively they defend capital during losing runs. Without strict stop-loss protocols, a single bad afternoon can wipe out months of disciplined gains.
The Fatal Myth of the Martingale System
Recreational players frequently resort to the Martingale doubling strategy: when a wager of ₹100 loses, they bet ₹200, then ₹400, then ₹800, hoping a single win recoups all prior losses plus a 1-unit profit.
In finite-capital environments, the Martingale system guarantees financial catastrophe. Consider what happens during a routine 8-step adverse variance run:
| Step in Sequence | Unit Bet Sizing | Cumulative Capital Wagered | Payout on Win (1:9 Single Ank) | Net Profit if Won | Risk of Ruin Probability |
|---|---|---|---|---|---|
| 1 | ₹100 | ₹100 | ₹900 | +₹800 | Base Risk |
| 2 | ₹200 | ₹300 | ₹1,800 | +₹1,500 | Normal |
| 3 | ₹400 | ₹700 | ₹3,600 | +₹2,900 | Moderate |
| 4 | ₹800 | ₹1,500 | ₹7,200 | +₹5,700 | Elevated |
| 5 | ₹1,600 | ₹3,100 | ₹14,400 | +₹11,300 | High |
| 6 | ₹3,200 | ₹6,300 | ₹28,800 | +₹22,500 | Critical |
| 7 | ₹6,400 | ₹12,700 | ₹57,600 | +₹44,900 | Severe |
| 8 | ₹12,800 | ₹25,500 | ₹115,200 | +₹89,700 | Total Bankroll Bankruptcy |
At step 8, you are risking ₹12,800 of hard capital—having already sacrificed ₹12,700—merely to salvage an initial small gain. In any independent probability trial with a 10% win probability, an 8-draw drought occurs with surprising regularity ($0.9^8 \approx 43%$ chance of seeing 8 consecutive misses). Doubling down is mathematical suicide.
The Three Mandatory Circuit Breakers
Instead of chasing losses, embed these three automated circuit breakers into your strategy:
- The 3-Unit Daily Stop-Loss: If your session losses reach 3 base units (e.g., ₹300 on a ₹100 base unit), the session is terminated immediately. Close your browser, shut off the app, and walk away.
- The 24-Hour Cool-Off Mandate: If you encounter two consecutive days of hitting your daily stop-loss, enforce a mandatory 24-hour analytical hiatus. Use this window to audit your strategy journal, review market data on Sara 567, and verify whether your assumptions were flawed.
- The Weekly Profit Extraction Threshold: When your cumulative net profit reaches 5 base units for the week, withdraw or transfer $50%$ of those profits directly into your Vault reserve. Banking tangible gains reinforces emotional discipline and guarantees that house money is never handed back during mean reversals.
Phase 6: The Quantitative Strategy Journal
What cannot be measured cannot be managed. If you do not record your decisions with scientific precision, you are merely gambling under the illusion of strategy.
Every serious practitioner maintains an immutable Strategy Audit Journal (whether in a digital spreadsheet or a physical ledger). For every single market interaction, record the following seven data points:
| Parameter | Example Record Entry | Strategic Purpose |
|---|---|---|
| 1. Date & Market | 2026-10-19 — Kalyan Matka (Open Session) | Tracks chronological performance across individual markets |
| 2. Target Wager Type | Single Ank (Open: 7) | Discloses whether your edge lies in Single Ank, Jodi, or Pana |
| 3. Unit Sizing & Value | 1.0 Unit = ₹150 | Audits whether you strictly followed pre-set risk sizing rules |
| 4. Analytical Rationale | Cold reversal from 45-day latency + Family Jodi parity | Prevents impulse bets; documents your reasoning before the draw |
| 5. Actual Result | Declared Open: 7 (Pana: 1-2-4) | Objective real-world performance record verified via Sara 567 |
| 6. P&L Net Outcome | +₹1,200 Net Profit | Quantifies actual financial return against risk exposure |
| 7. Emotional Rating (1–5) | Rating: 1 (Completely calm, zero impulse) | Measures psychological discipline and identifies tilt triggers |
The Monthly Performance Metric: Expectancy Ratio
At the end of every calendar month, calculate your System Expectancy ($E$): $$E = (P_{\text{win}} \times W_{\text{avg}}) - (P_{\text{loss}} \times L_{\text{avg}})$$ Where:
- $P_{\text{win}}$ is your win rate percentage.
- $W_{\text{avg}}$ is your average net win in units.
- $P_{\text{loss}}$ is your loss rate percentage ($1 - P_{\text{win}}$).
- $L_{\text{avg}}$ is your average loss in units.
If $E > 0$, your system possesses a positive empirical edge under your bankroll rules. If $E \le 0$, your system is bleeding capital to friction and variance, requiring an immediate overhaul of your wager allocation or unit sizing.
Phase 7: Cognitive Hygiene & Eradicating Emotional Tilt
Even the most sophisticated mathematical strategy collapses if the human operating it succumbs to psychological breakdown. In gaming and trading psychology, Tilt refers to a state of emotional frustration where rational decision-making is completely hijacked by the amygdala.
The Anatomy of the Tilt Spiral
- The Catalyst: A perceived "bad beat" (e.g., your selected Jodi was
47, and the market declared48—a near-miss). - The Cognitive Distortion: The brain interprets a near-miss as "almost winning," releasing dopamine and generating an illusory belief that the next result is predictable.
- The Rule Violation: You ignore your pre-defined 1% unit limit and wager 5 units on the Close session to "avenge" the near-miss.
- The Compounding Loss: The Close outcome fails, deepening emotional anger and inducing acute panic.
- Total Account Depletion: You empty the session buffer and tap the Vault reserve in an out-of-control chasing frenzy.
Near-Miss Event (Jodi 47 vs 48)
      │
      ▼
Cognitive Distortion ("I'm due to hit on Close!")
      │
      ▼
Rule Breach (5x Unit Sizing)
      │
      ▼
Secondary Drawdown & Panic
      │
      ▼
Total Capital Destruction
The Pre-Session Mental Readiness Checklist
Before allocating any capital on any given day, score yourself against this 4-point psychological screen:
- Physical State: Am I well-rested, sober, and free from external emotional stress or financial anxiety?
- Capital State: Is the capital I am using today $100%$ disposable entertainment funds whose total loss would not affect my lifestyle?
- Plan Integrity: Have I written down my specific selections and unit sizes before the market window opens?
- Acceptance of Variance: Do I fully accept that this session may end in a 100% loss of my session units, and am I prepared to walk away without chasing?
If you answer "No" to any of these four questions, do not place a wager today. Protecting your emotional capital is just as vital as protecting your financial capital.
How Sara 567 Serves as Your Strategic Analytical Engine
Executing a systematic betting strategy requires instantaneous, reliable, and mathematically accurate information. Relying on disorganized social forums or unverified blogs introduces latency, transcription errors, and confusion.
Sara 567 is purposefully engineered from the ground up to serve as the premier analytical command center for data-driven enthusiasts:
| Analytical Feature | Sara 567 Strategic Advantage | Strategic Impact for the User |
|---|---|---|
| Instant Live Declarations | Millisecond-accurate socket updates directly from source markets | Eliminates delayed information; enables prompt execution of session plans |
| Decade-Long Chart Archives | Comprehensive, unbroken Jodi and Pana panel histories | Provides the deep $N \ge 60,000$ sample sizes required for statistically valid auditing |
| Mobile-First Responsive UI | Ultra-clean interface optimized for smartphones, tablets, and desktop | Execute strategy audits anywhere without slow load times or intrusive popup ads |
| Zero Misleading Claims | 100% factual, historical, and mathematical reporting with zero "fix leaks" | Protects users from predatory schemes; promotes transparent, disciplined analysis |
| Multi-Market Coverage | Unified tracking for Kalyan, Milan Day/Night, Rajdhani Day/Night, Time Bazar | Consolidates all operational records into a single, standardized analytical screen |
Frequently Asked Questions (FAQs)
1. Can a betting strategy guarantee 100% wins in Satta Matka?
No. Anyone claiming a 100% winning system or "fix leak" number is perpetrating a fraudulent scam. Satta Matka is fundamentally a game of chance governed by combinatoric odds and uniform random distributions. A disciplined strategy does not guarantee winning every draw; it prevents catastrophic losses, manages risk through unit sizing, and optimizes your capital longevity across hundreds of sessions.
2. What is the ideal bankroll size to start with?
Your bankroll should represent an amount of discretionary capital that you can afford to lose entirely without any emotional distress or financial hardship. Whether your bankroll is ₹2,000 or ₹50,000, the critical rule is scaling your unit size strictly to 1% or 2% of that total amount.
3. Why should I avoid the Martingale system?
The Martingale system requires doubling your wager after every loss. In games with low-probability, high-multiplier outcomes, losing streaks of 6 to 10 consecutive draws occur frequently. Under Martingale, doubling wagers exponentially exhausts your capital within minutes, risking thousands of rupees just to recoup an initial ₹100 bet.
4. How often should I audit my historical charts?
Conduct a comprehensive chart audit once a week—ideally over the weekend when major weekday markets are closed. Use this quiet period to review 30 to 90 days of verified results on Sara 567, calculate your monthly Expectancy Ratio, and update your strategy journal.
5. Which market is best for a beginner implementing a strategy?
Kalyan Matka is universally recognized as the benchmark market for beginners. It features over 60 years of documented historical records, massive liquidity, transparent operational schedules, and a steady 6-day cadence that gives analysts ample time between daily sessions.
Responsible Gaming & Analytical Ethics
The mathematical frameworks and strategic models outlined in this guide are provided strictly for educational, historical, and risk-mitigation purposes. Satta Matka involves real financial risk and can become psychologically addictive if approached without strict boundaries.
Always adhere to these ethical guidelines:
- Never wager money allocated for living expenses, rent, groceries, healthcare, education, or family obligations.
- Never borrow capital or take loans to participate in any betting market.
- Treat numerical wagering strictly as an intellectual exercise and entertainment expense, never as an income-generating investment or debt-relief strategy.
- If you find yourself unable to stop betting, experiencing acute distress, or lying to loved ones about your participation, cease immediately and seek professional counseling from dedicated organizations such as Gamblers Anonymous.
Stay disciplined, trust only verified data on Sara 567, and always protect your capital first.
Full stack developer and marketing expert specializing in scalable web architecture, SEO optimization, and data-driven analytics for digital platforms.