What Does Number Frequency Mean in Historical Matka Data?
What Does Number Frequency Mean in Historical Matka Data?
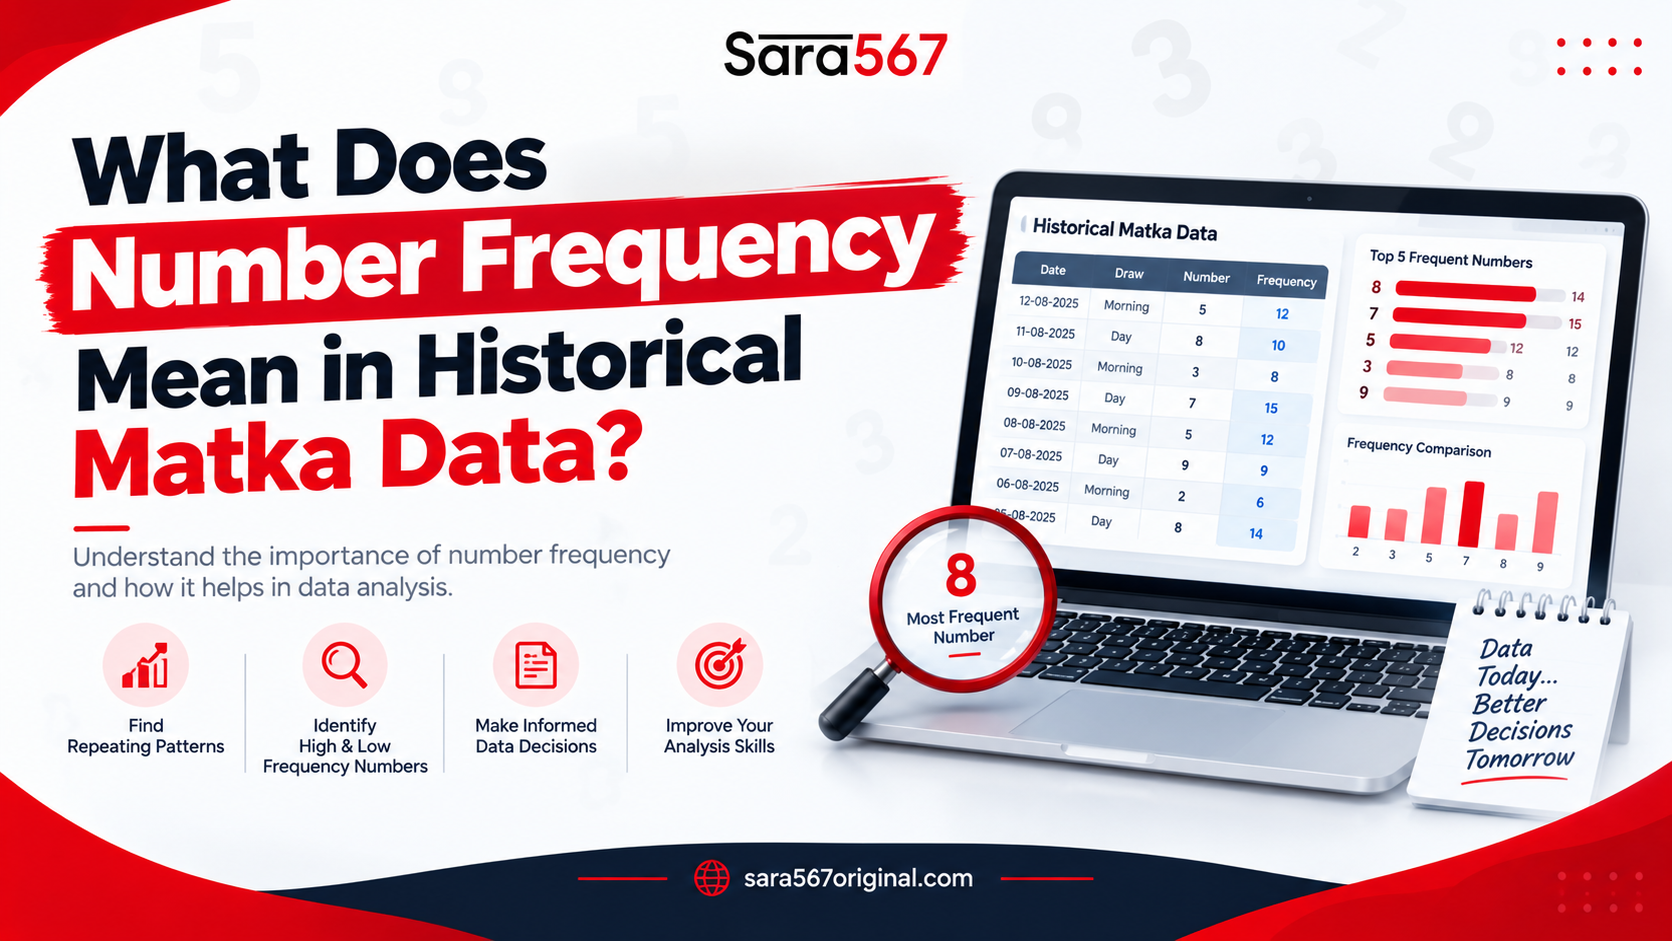
Newcomers to the discussion of frequency in past data sheets might often find themselves confused by multiple summaries, tables, and charts. One of the first concepts to become familiar with when learning to read these documents is the matka number frequency.
Essentially, it refers to the amount of times a particular digit, combination, or number appears in a set of records within a given timeframe. This information is useful in that it helps summarize the characteristics of a chosen set of data, although it does little in predicting potential results. For instance, if a researcher uses a sheet that covers thirty days and finds that the number 23 appears there three times, its frequency for this specific set would be equal to 3.
While it helps to know the overall number of occurrences, one should bear in mind that it says little about the likelihood of it happening again in the next thirty days or so. Understanding how researchers work with existing sets is, therefore, an essential part of the process.
What Does Number Frequency Mean?
Generally, the term frequency refers to how often an event occurs over a period of time. When it comes to the frequency in historical records, this term is used to summarize how often a certain result appears across a set of data.
To simplify the concept, one might imagine a small sample sheet that contains the results for ten consecutive days:
- Day 1: 4
- Day 2: 7
- Day 3: 4
- Day 4: 1
- Day 5: 9
- Day 6: 4
- Day 7: 2
- Day 8: 7
- Day 9: 0
- Day 10: 5
Using the simple calculations, one can then find out the number of times a particular digit appears in this set. In this sample, the number 4 appears three times, while 7 appears two times, and the rest show up only once. The frequency of any given occurrence then becomes a decimal that represents the ratio of times that number appeared over the total number of entries. In this example, the frequency for the number 4 would be 3/10 or 0.3. Note that this property has nothing to do with the likelihood of this number appearing again in a set of results. It is purely a summary of historical data. The same principle can be applied to Jodis, Panas, or any other system involving single or multiple digits.
How Is Number Frequency Calculated?
Generally, finding the frequency of a number is a relatively simple process that involves no complex mathematical formulas. The six steps below should help anyone learn how to calculate the number frequency in Matka records.
-
First, the analyst should define a certain market and choose a set of dates that this research will focus on.
-
Using online resources, one can then enter and collect all the data entries that fit within this timeframe.
-
The next step depends on what the researcher wants the frequency to summarize. In this scenario, one might want to see how often specific digits appear individually or together.
-
After that, the number of occurrences for each entry should be tallied. For best practices, it is advised to display the digits and the amounts in two columns.
-
Finally, the collected amounts should be processed to show the difference between the numbers.
Note that the numbers to the left can be anything that the analyst wants to be summarized, as long as they fall into a single market category. The dates should also be defined to ensure that the records are processed in appropriate sets. If any of these conditions is not followed, the final information might appear to be misleading and confusing to a novice researcher.
Simple Example of Number Frequency
As mentioned above, the frequency in Matka historical records refers to how often certain numbers or digits appear in this set. The example below displays the information in a tabular form. All entries are fictional and are provided solely for practice and educational purposes.
| Number | Example Occurrences | Frequency |
|---|---|---|
| 23 | 3 | 3 |
| 51 | 1 | 1 |
| 74 | 4 | 4 |
| 92 | 2 | 2 |
The example above presents hypothetical occurrences of the digits 23, 51, 74, and 92. The term “examples” in the second row indicates that each number appears more than once within the selected set. All entries are fictional and intended solely for practice, reference, and educational purposes.
Why Date Range Matters
A common mistake that can mislead analysts is overlooking how significantly the selected date range can affect the final results. Essentially, the larger the range of dates that the researcher processes, the wider the variety of results that they can expect. For instance, an entry that includes only 30 days might have an array of numbers with equal frequency. As the range expands to cover several months, certain digits begin to appear more often, while others continue to stay the same. In short, if a frequency chart is misleading, double-checking the dates is often the best way to start finding errors.
Interpreting Frequency in Matka History
Understanding how to interpret historic matka information demands a methodical manner in order to avoid misunderstandings. While considering frequency summaries, you should take note of these important points:
-
Confirm the market name: Make sure all entries are from the same market, since if different market entries are mixed, the counting becomes incorrect.
-
Validate the date range: Always ensure the exact calendar period that is being covered.
-
Look into the counted field: Determine if the frequency covers open numbers, closed numbers, or whole jodi results.
-
Compare only within datasets: Only frequencies gathered under the same conditions and dates should be considered during comparison.
-
Keep past separate from prediction: Historical data should simply be seen as a record of the past.
-
Check completeness for the dataset: Ensure that there are no missing dates in the records.
By following this practical matka historical data guide, readers can maintain a clear, objective view of historical tables.
Number Frequency Does Not Predict Future Results
A common mistake of those who decide to interpret the historical data incorrectly is a belief that the frequency values can be used to predict upcoming results. The explanation as to why this is simply impossible is relatively straightforward: each combination in Matka games of chance is entirely independent of previous draws.
The facts of past occurrences are irrelevant and can only provide an accurate summary of already happened events. To illustrate this point, one may compare the likelihood of a horse race, where the outcome depends exclusively on the weight and health condition, and the odds of Matka games, which are random by nature. Bearing these simple principles in mind is vital when one decides to take a closer look at any kind of Matka historical data.
Understanding Frequency on Sara 567
Those who want to review and analyze certain historical records are encouraged to use the online platform that provides all the necessary details in an organized manner. On Sara 567, one can find an array of results that were gathered across various popular markets. From Kalyan to Rajdhani, Sara 567 covers all the essential options in the game. Now, let us take a closer and more detailed look at the steps that one should take when reviewing the documentation that this platform offers.
Firstly, use the dropdown menu on the website to select an option corresponding to a chosen market. The next step is to choose the specific range of dates on top of the selected sheet. At this point, the user can either examine the Jodi or Pana result and determine the likelihood of particular digits and combinations appearing in this set of results.
Common Mistakes When Reading Frequency
To conclude, here is a short list of some common pitfalls that a novice researcher should keep in mind before proceeding to read Matka historical data. More specifically, it is crucial to remember not to compare different date ranges together, as the difference in these sets would produce results that appear to be irrelevant. Moreover, one should make a distinction between various markets that might be considered independently.
Following the same principle, the researchers should analyze the frequency of single open digits and Jodis separately, as different categories should not be mixed. In addition, it is also essential to remember that the information in these sets should not affect any future forecasts of the game. Finally, in no case should the analyst use this kind of information when there are any missing days. In all these circumstances, the results can be considered incorrect.
Conclusion
To summarize, the term frequency refers to how often events occurred within a period of time. As applied to the Matka system, the number frequency means how often individual digits or entire numbers appeared in a selected set of historical data. This method is great and helps to summarize a group of past results, although it does little in determining what might happen next. To ensure that the numbers are considered in an accurate way, it is essential to use a specific set of dates and verify that no errors were in included in the selected entries. In short, knowing what frequency means when applying to the Matka games of chance is the first step in determining how different types of digits appear across different sets of historical records.
Frequently Asked Questions
1. What does number frequency mean in Matka data?
Number frequency refers to how often the specific number appears in a set of data in a given timeline. It is simply used to indicate how often events happened.
2. How is Matka number frequency calculated?
Frequency is generally calculated when an appropriate set is given. So, first of all, select a specific market and duration. Then collect the past entries. Following that, count the occurrences of each given number and put it in a simple table form.
3. Does a frequently appearing number have a higher chance of appearing again?
No. Actually, the past occurrences do not have anything to do with new forecasts. We can never predict the results based on historical data.
4. Why does the range of the date affect the number's frequency?
Well, each day will give you a new set of data that will affect the values. As the dates change, the values of the occurrences will be as well.
5. Can historical frequency predict future Matka results?
No, it cannot. We can only analyze the results and know that it only represents the data and not the chances of future occurrences.
SEO expert and digital content researcher tracking market trends, data verification, and informational guides across digital platforms.